I came across some problems with memory usage in Julia DMRG and wanted to share my findings (similar to discussions in Large amount of memory used, when dmrg runs on cluster and memory usage in dmrg (julia) )
- tl;dr add
GC.gc()to an observer or use a small--heap-size-hint, or use a version other than 1.9
Experiment
I created a test case of DMRG with no quantum numbers on a 16 site non-interacting chain of electrons (H=\sum_{i\sigma} c^\dagger_{i\sigma} c_{j\sigma}). I slowly increase the bond dimension, running over 15 sweeps
Sweeps
1 cutoff=1.0E-16, maxdim=64, mindim=1, noise=1.0E-03
2 cutoff=1.0E-16, maxdim=64, mindim=1, noise=1.0E-04
3 cutoff=1.0E-16, maxdim=64, mindim=1, noise=1.0E-08
4 cutoff=1.0E-16, maxdim=64, mindim=1, noise=1.0E-08
5 cutoff=1.0E-16, maxdim=128, mindim=1, noise=1.0E-08
6 cutoff=1.0E-16, maxdim=128, mindim=1, noise=1.0E-08
7 cutoff=1.0E-16, maxdim=128, mindim=1, noise=1.0E-08
8 cutoff=1.0E-16, maxdim=128, mindim=1, noise=1.0E-08
9 cutoff=1.0E-16, maxdim=256, mindim=1, noise=1.0E-08
10 cutoff=1.0E-16, maxdim=256, mindim=1, noise=1.0E-08
11 cutoff=1.0E-16, maxdim=256, mindim=1, noise=1.0E-08
12 cutoff=1.0E-16, maxdim=256, mindim=1, noise=1.0E-08
13 cutoff=1.0E-16, maxdim=256, mindim=1, noise=1.0E-08
14 cutoff=1.0E-16, maxdim=256, mindim=1, noise=1.0E-08
15 cutoff=1.0E-16, maxdim=256, mindim=1, noise=1.0E-08
I record the peak memory usage (maxRSS)
Code
# see https://github.com/JuliaLang/julia/blob/master/test/netload/memtest.jl
struct RUsage
    ru_utime_sec::Clong         #  user CPU time used
    ru_utime_usec::Clong        #  user CPU time used
    ru_stime_sec::Clong         #  system CPU time used
    ru_stime_usec::Clong        #  system CPU time used
    ru_maxrss::Clong            #  maximum resident set size
    ru_ixrss::Clong             #  integral shared memory sizeG
    ru_idrss::Clong             #  integral unshared data size
    ru_isrss::Clong             #  integral unshared stack size
    ru_minflt::Clong            #  page reclaims (soft page faults)
    ru_majflt::Clong            #  page faults (hard page faults)
    ru_nswap::Clong             #  swaps
    ru_inblock::Clong           #  block input operations
    ru_oublock::Clong           #  block output operations
    ru_msgsnd::Clong            #  IPC messages sent
    ru_msgrcv::Clong            #  IPC messages received
    ru_nsignals::Clong          #  signals received
    ru_nvcsw::Clong             #  voluntary context switches
    ru_nivcsw::Clong            #  involuntary context switches
end

function get_vmsize()
    ru = Vector{RUsage}(undef, 1)
    ccall(:getrusage, Cint, (Cint, Ptr{Cvoid}), 0, ru)
    return ru[1].ru_maxrss
end
This machine has 188GB so plenty of room, and there’s no slurm involved.
Results
I ran the test above on several Julia versions (1.8,1.9,1.10-beta).
Essentially if you use the latest release version of Julia (1.9.2), the peak memory usage (maxRSS) continues to grow compared to previous and newer versions
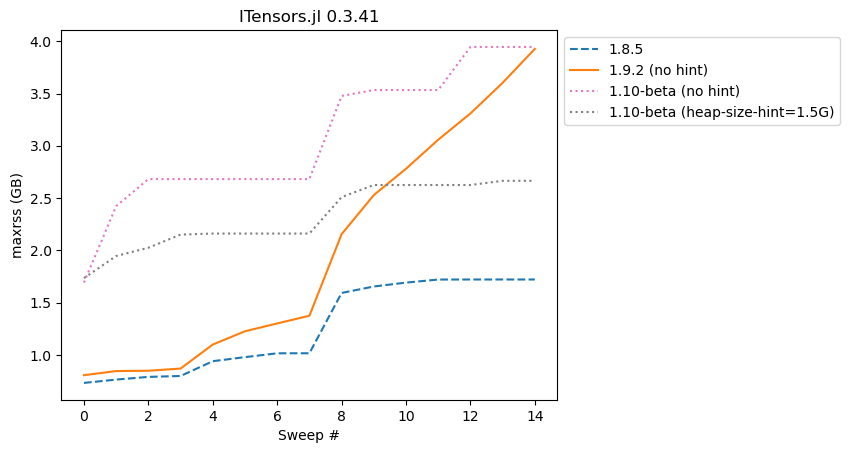
1.8.5 uses the least amount of memory, and 1.10-beta uses more (a trade off for faster compiling I believe) while 1.9.2 will slowly explode. In my production code with 1.9.2 the total RAM usage ends up at > 1TB after enough time, so don’t let the small size here fool you.
Possible Solutions

First, and probably the easiest, you can add in an observer that runs garbage collection
mutable struct GCObserver <: AbstractObserver
end

function ITensors.measure!(o::GCObserver; kwargs...)
  bond = kwargs[:bond]
  half_sweep = kwargs[:half_sweep]
  (bond==1 && half_sweep==2) && GC.gc()
end
I only tried the above, but let me know if anyone suggests a different frequency than 1/sweep.
That seems to work well and reduced the memory significantly but I have not benchmarked the total time differences for larger problems.
The other solution is the often recommended --heap-size-hint flag. I find that you really want this number smaller than your total memory so that the garbage collection is run (purple line vs red line), if the environment is very ram sensitive.


